
Use the Console and Serial Monitor tabs: baud rate, line endings, data rates, reset and troubleshooting.
Serial Monitor & Output
The Output Panel at the bottom of the screen is where the IDE reports compilation, upload and Serial activity. It is divided into two independent tabs — nothing is shared between them.
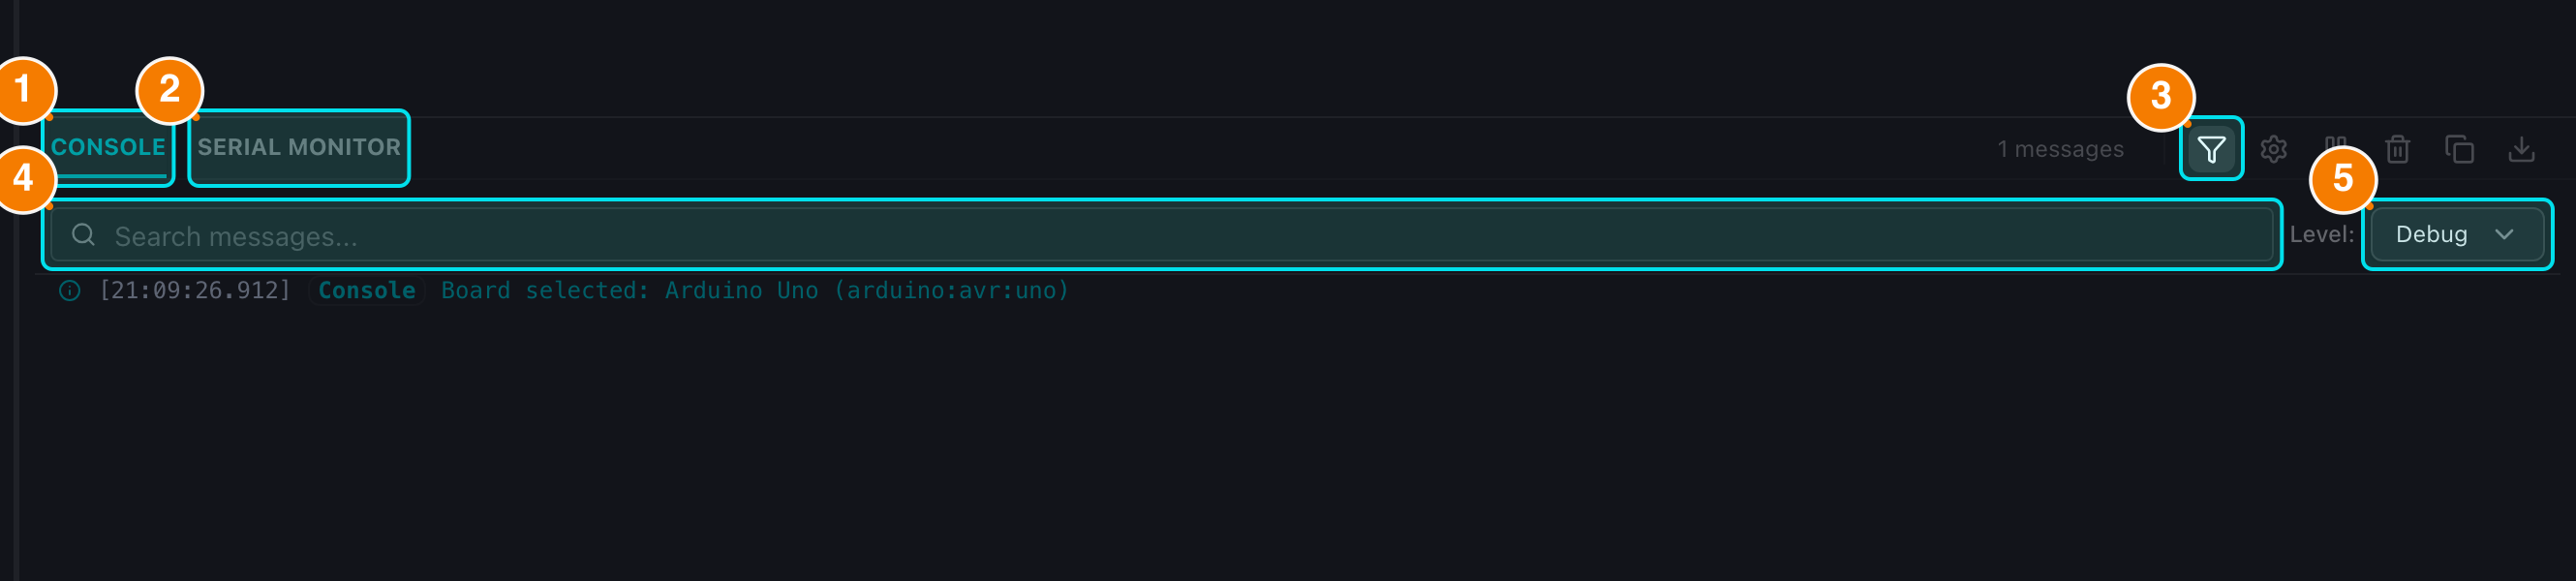
(1) CONSOLE tab. (2) SERIAL MONITOR tab. (3) Filter toggle. (4) Search box. (5) Level filter.
Console Tab
The Console displays system messages, compilation logs and upload progress.
- Compilation: When you press Verify, the compiler output streams here. You will see a success message with Flash/RAM usage, or detailed GCC errors (file, line, column and reason).
- Upload: Logs the start of the upload and the success message. Detailed upload percentages are not printed.
- Filtering: Use the level dropdown (Debug, Info, Warning, Error, Success) and the search box to narrow a long log. The Debug level is the default and shows everything.
- Counters: The toolbar always shows the number of errors (red) and warnings (yellow).
- Fix with AI: On a compilation error, click Fix with AI next to the message to send the error and the related code to the AI in Debug mode.
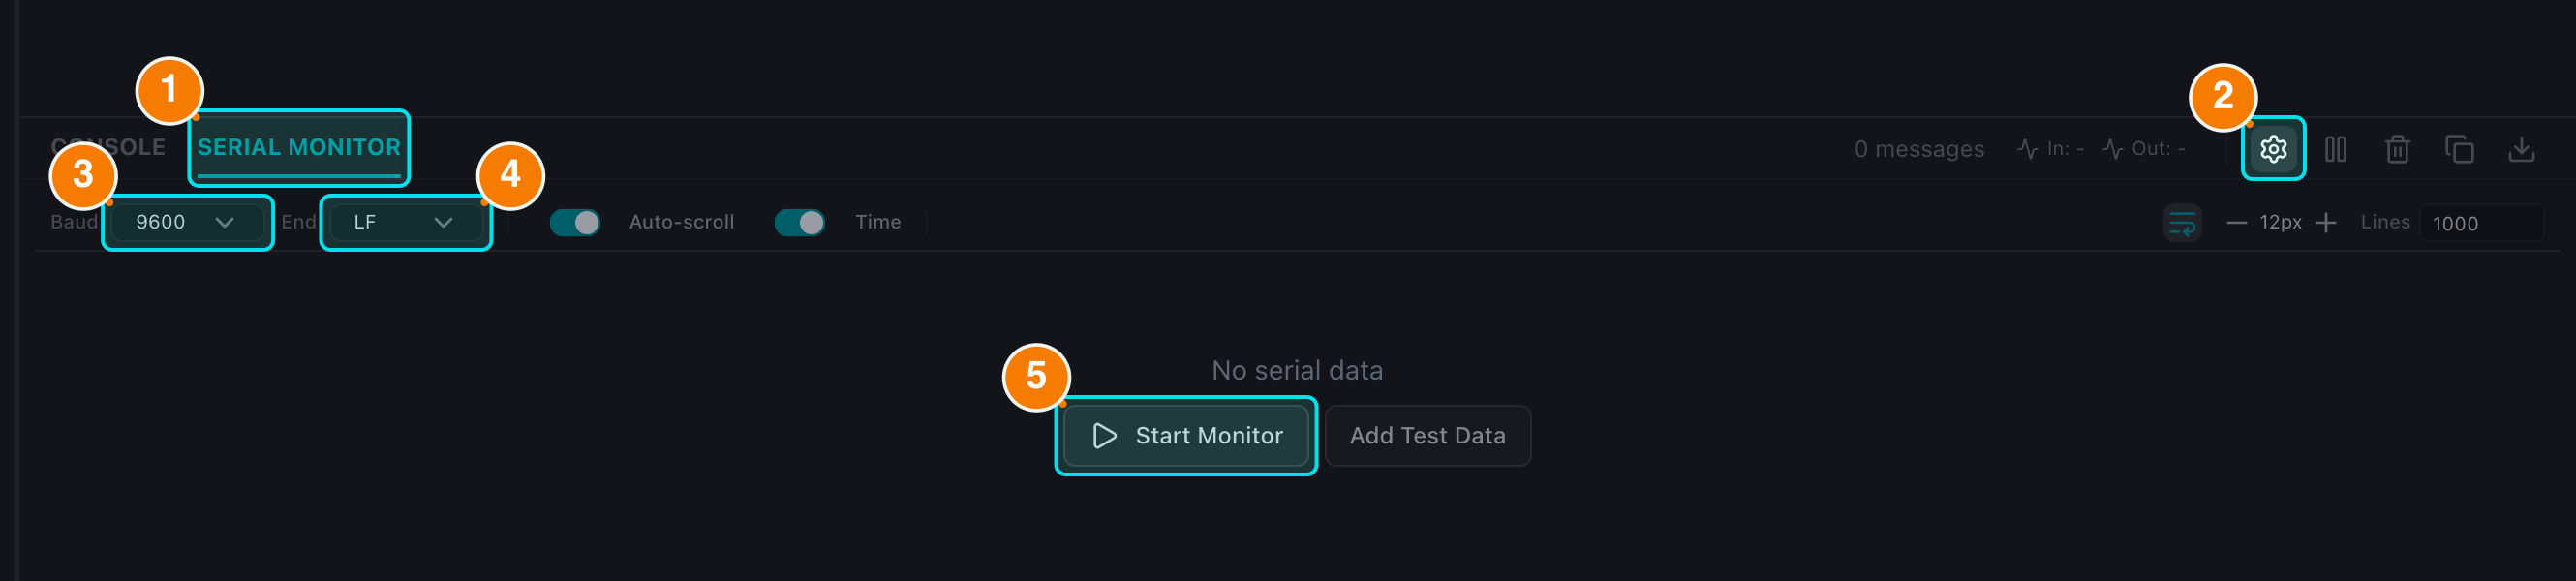
(1) SERIAL MONITOR tab. (2) Settings. (3) Baud rate. (4) Line ending. (5) Start/Stop Monitor.
Serial Monitor Tab
The Serial Monitor exchanges data with the board over the Serial/USB port.
Setup
- Connect the board and select its port in the Header.
- Open the panel with the
> _icon orCtrl/Cmd + M. - Open Settings (gear icon) and choose the Baud Rate matching your
Serial.begin(RATE).- Default: 9600.
- Common values: 9600, 57600, 115200.
- Full list: 300, 1200, 2400, 4800, 9600, 19200, 38400, 57600, 115200, 230400, 460800, 921600.
- Press Start Monitor (green Play). The button changes to Stop Monitor (red square) while the session is running.
Sending Data
- Input: Type a command into the bar at the bottom.
- Send: Press
Enteror click the Send button. Empty or whitespace-only commands are blocked, and sending is disabled while disconnected. - Command History: Use
↑/↓to reuse previously sent commands. - Line Endings: Configure in Settings — None, Newline (LF), both CRLF (NL & CR) or Carriage Return (CR).
Viewing Output
- Pause/Resume: Pause auto-scroll to read older lines without the view jumping to the bottom.
- Clear: Trash icon — clears the Serial log only; the Console keeps its own history.
- Timestamps / Word wrap / Font size / Max lines: All available in the Settings panel and applied instantly.
- Copy & Export: Copy the log to the clipboard, or download it as a
.txtfile. - Data Rate: The toolbar shows real-time throughput (
B/s,KB/s) while connected. - Reset Board: Sends a reset signal over the Serial control lines (no physical button needed).
- Add Test Data: With no board attached, use this button to insert sample lines and check the display.
Troubleshooting
"Port Busy" or "Access Denied"
- Make sure no other software (Arduino IDE Desktop, slicer software...) is using the COM port.
- Unplug and replug the USB cable, then use the refresh button in the Port dropdown.
- Reload the browser page.
Gibberish Characters
- The Baud Rate is probably mismatched. Check
Serial.begin()in your sketch and select the same value in Settings.